As a resident of Siesta Key, I love working on my home turf. It is easy for me, someone who chose to relocate my life to Siesta Key, to see what attracts others to our incredibly beautiful and special island life! As a local expert, I look at the market conditions. the. time. and we have some interesting trends happening right now on our home Key. In this blog, I will dive into some recent statistics about the Siesta housing market.
Siesta Key General Market Report
There are a few data points I'm going to cover for Siesta Key. First, I'll give you the data for the entire key's residential properties, and then get into specifics about the single-family home and condo markets.
- Average Sales Price per Square Foot: A property's final sales price divided by the number of square feet gives us this data point. It's a good way to estimate the value of your own home if you want a ballpark of worth, but don't forget every home has to be individually evaluated for property valuation, both for real estate sales purposes as well as appraisals. So while this is a good estimator, it is only that!
- Average & Median Sales Price: The average sales price is the average of all residential sales. The median sales price is the middle-most number in that data set if you arranged them from lowest to highest. The media can sometimes be a better indicator because it falls in the middle, which gets rid of outliers dragging the average up or down.
- Sales Price to List Price Ratio: This is the percentage of the home listed sale price (at the time of sale) compared with how much the final sales price was. A $100,000 home (for round numbers purposes) selling for $96,000 has a 96% list-to-sales price ratio.
Here are the data for all of Siesta Key, as of the end of April 2022.
Average Price per Sq Ft
For the entirety of Siesta Key, we see a trend line rising over the last 12-20 months at a much steeper rate than ever before! The average sales price per square foot in April 2022 was $751, over 36% higher than just one year ago when it sat at $550.
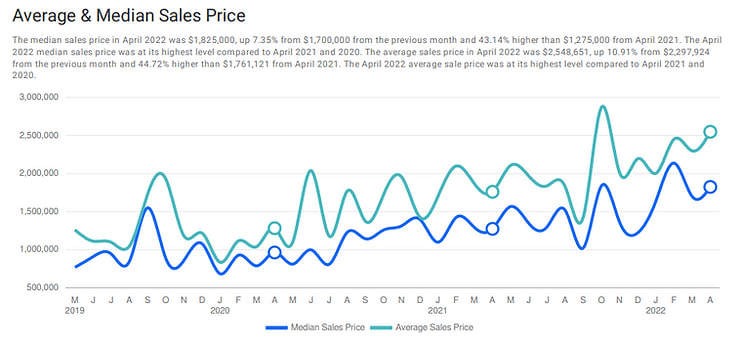
Average & Median Sales Price
The average sales price is indeed dragged higher than the median by quite some, thanks to the key's wealth of ultra-luxury properties. In just the month of April, 19 properties were sold on Siesta with a final sales price above $5 million, including 2 with a sales price over (and well over!) $10 million. The median is a better indicator, in this case, of what a more normal, not ultra-luxe, home is selling for. In April 2022, the average sales price was $1,446,417, up nearly 52% from one year prior. The median sales price was $997,500, up 47.78% from April 2021.
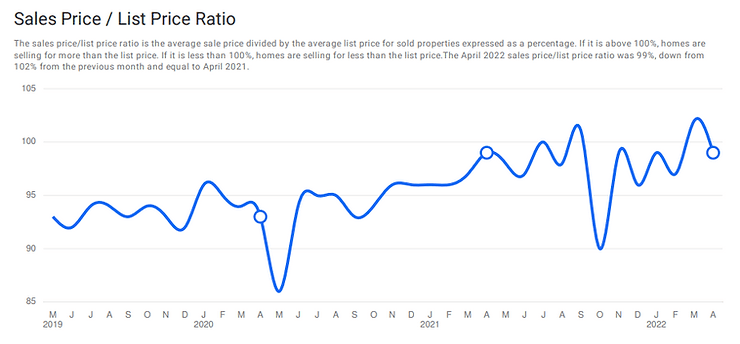
List Price: Sales Price Ratio
It has been quite a long time since we saw the average list-to-sale price ratio crest 100%, meaning most homes are going for above list price. We saw that in March (101% ratio) of this year, followed by a small dip back to 99%. Sellers are still rejoicing at this level, as low inventory has kept their property values very competitive indeed.
The Siesta Key House Market
Let's look specifically at the single-family home market on Siesta Key.
Average Price per Sq Ft
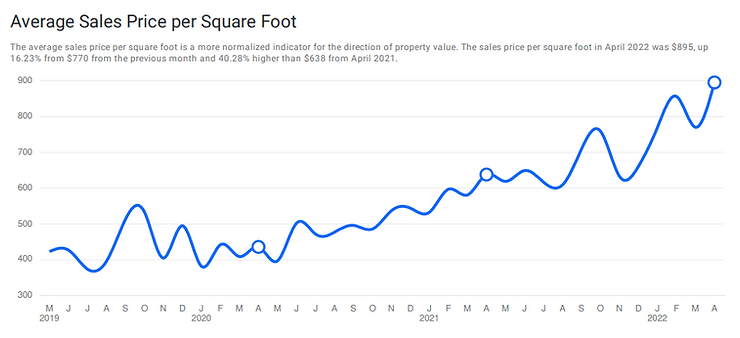
Just like the general market above, the trendline here has increased in steepness over the last 2 years substantially. April 2022's average PPSF went is over 40% higher than April 2021, which were $895 and $638, respectively.
Average & Median Sales Price
As with the general Siesta Key market, the average here is above the median for the same reasons mentioned above. April 2022's average sales price for a single-family home ($2,548,651) is 44.72% higher than April 2021's $1.76+ million average and the median has also jumped by quite a margin: April 2022's median was $1,825,000, a soaring 43% up from $1,275,000 at this time last year.
List Price: Sales Price Ratio
Single-family homes on Siesta Key averaged more than a 100% ratio, meaning the average home sold for more than the list price, already twice in the past 12 months: in March 2022 and before that September 2021. In April, the ratio dropped 3% month over month to 99%, which is the same as this time last year. The bottom line: Siesta single-family homes are a hot commodity. Prepare to pay at or near the list price!
The Siesta Key Condo Market
Average Price per Sq Ft
We see again a drop here from March 2022 to April 2022, easily explained by our island's seasonality. The high season ends around Easter, which this year was mid-April. The spring break rush ends and a lot of our visitors and potential buyers vacate the market, at least temporarily. That said, condos on Siesta Key are still selling for a quite high PPSF: $675 on April 22, nearly 30% higher than the same month in '21, where the average was only $520.
Average & Median Sales Price
Okay, what we see here in the condo market that is unique in this report is this: the average and the median are much closer together than in the SFH market, sometimes even intersecting. This indicates that the price range for condos is less likely to have the outliers that the SFH market possesses. April 2022's average was $862,881, up 31.45% from this time last year, and the median was $790,000, up 41% from April 2021.
List Price: Sales Price Ratio
Condos on Siesta have been hovering in the high 90s for months now, not having dipped below 96% in more than 2 years. Last month's average was 99%, yet again down from March's high of 100%, but up from 98% last April. Overall, however, the list-to-sales price ratio for condos on Siesta is pretty consistent.